The exponential problems of predicting the future

Inzichten

The exponential problems of predicting the future

Technological change is an area in which individuals have consistently underappreciated pace. Through the decades our ability to adopt/consume technology has increased significantly (Figure 1). However, as humans, we regularly fail to appreciate this fact and as such disruptive technologies are often initially overlooked.

Figure 1: Waves of technological change
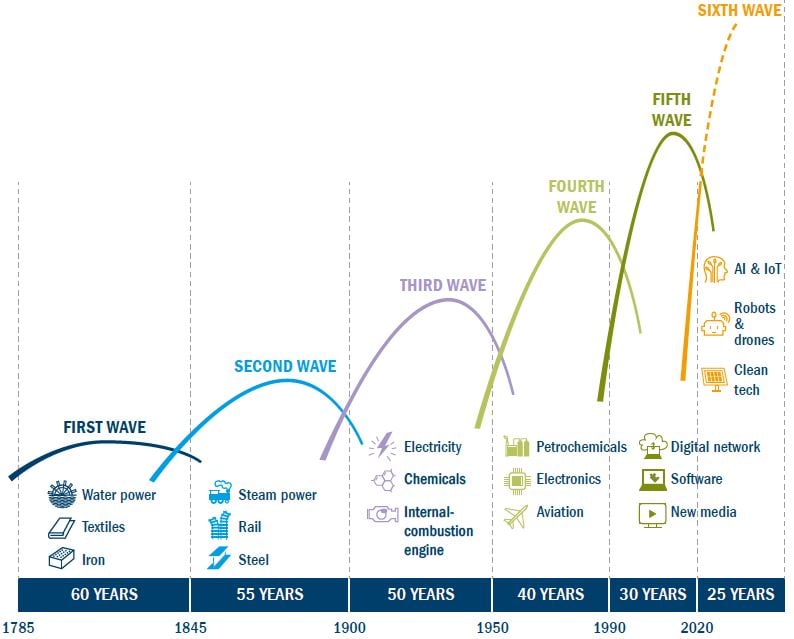
Waves of technological change

Source: Visual catalyst and Edison Institute, 2021

A famous example of the underappreciation of the pace of technological change is telecommunication firm AT&T asking McKinsey in the 1980s to forecast mobile phone adoption in the US in 2000. At the time handsets were clunky, calls were filled with static, data services were non existent and coverage was patchy – yet it was already becoming clear that mobile technology had practical benefits. McKinsey ultimately concluded there would be 900,000 mobile phone users in the US in 2020; the actual figure was just over 100,000,000. McKinsey had failed to account for the significant cost reductions in the core components of handsets coupled with the growing capabilities of networks such as the introduction of data services. Thus, a £3,000 phone in 1984 became a £200 handset in 2000.1
A key tenet of human behaviour is the systematic tendency to incorporate heuristics, for example rule of thumb, into decision making and/or the construction of narratives. However, this can often be inherently limiting. For example, one of the most pervasive biases in human decision making is anchoring, whereby individuals confronted with figures have a systematic tendency to fix upon some available reference point, adjust their responses around it and provide a linear extrapolation to arrive at their projection.
Forecasting is one such discipline where the anchoring bias is particularly prevalent but overcoming it is challenging. In the short term a forecaster may get lucky and be correct as an exponential curve at this point is closer to being linear, but as time moves on the divergence of the exponential effect increases and the forecast becomes less and less accurate. Successful forecasters tend to unshackle themselves from the anchoring bias and are able to consider 45% the future in a nonlinear manner.
History is littered with examples of forecasters failing to do this and with hindsight it is easy to mock. However we are living through a period where the social and environmental risks to the global economy have arguably never been higher and this is likely to drive technological progression at an unprecedented level, thus providing significant investment opportunity for those able to ride the wave. On the other hand, there will likely be financial consequences for those who fail to anticipate the rapid rates of adoption of some of these technologies.
In 1890 there were 13,800 companies in the US in the business of building carriages pulled by horses. And in 1900 in New York alone there were 6,000 horses hauling New York trolleys – more than in all US cities combined. But just 17 years later the horse-pulled trolley took its last trip, and by 1920 only 90 carriage building companies remained2. This disruption was driven by the exponential rise of the automobile shown in Figure 2.
Figure 2: How New York became a one-horse town
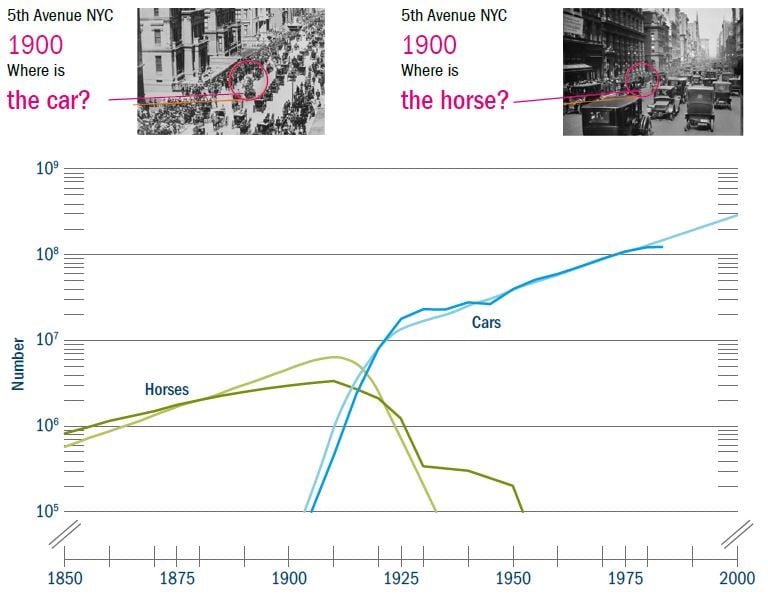
How New York became a one horse town

Source: Visual catalyst and Edison Institute, 2021

In 1903, the year Henry Ford founded Ford Motor Company, 11,235 automobiles were sold to Americans. Just a decade later Ford flipped the switch on the first assembly line, cutting the time it took to build a car from 12 hours to 2.5 hours. That year the number of cars produced in the US mushroomed to 3.6 million − a 300-fold increase. By 1923 the country was producing 20 million automobiles a year3.

The next rapid transition?

Climate change is impacting decisions at all levels of the global economy, ranging from governments through to corporates and individuals. A key driver in the world’s decarbonisation plans is renewable energy and specifically the ability for swathes of the economy to increasingly run off variable renewable energy sources such as wind and solar energy. Today, all forms of renewable energy (including hydropower and nuclear) account for just under 40% of total electricity produced globally (Figure 3). This has been driven by an exponential reduction in renewable energy costs which have come about initially through policy support and a necessity for emissions reductions.
Figure 3: Share of low-carbon sources and coal in world electricity generation
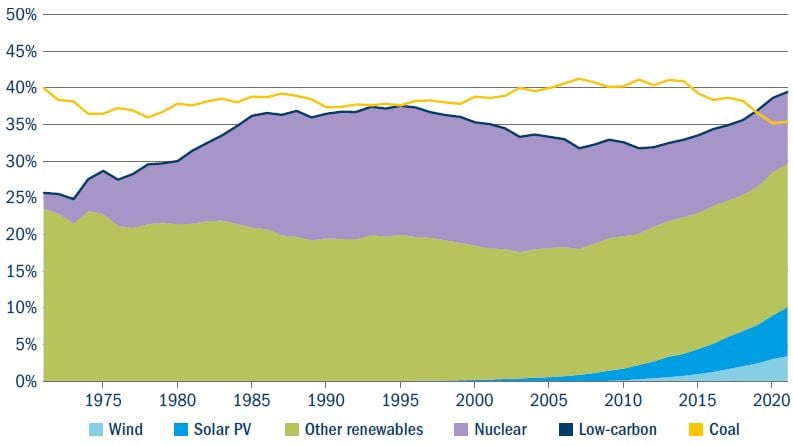
Share of low-carbon sources and coal in world electricity generation
Source: IEA 2021
However, the snowball effect and magnitude of this increase in renewables was not anticipated. In fact, the International Energy Agency (IEA) has systematically underestimated the amount of electricity generated by solar power in the past 20 years (Figure 4). In 2009 it predicted that by 2015 there would be 5GW of solar power installed globally. In fact, the actual figure for 2009 itself eventually turned out to be 8GW. In 2010 the forecast for 2015 was upgraded to 8GW, and in 2011 to 11GW. In 2012 the IEA further revised its prediction for 2015, this time to 24GW, and in 2014 the forecast for 2015 was for 35GW of solar capacity. In the end the actual capacity installed by 2015 was 56GW. This trend of underestimating continued, and by 2019 the annual growth forecast for 2020 was off by 100%.
Figure 4: IEA new solar additions per year, forecast versus actual
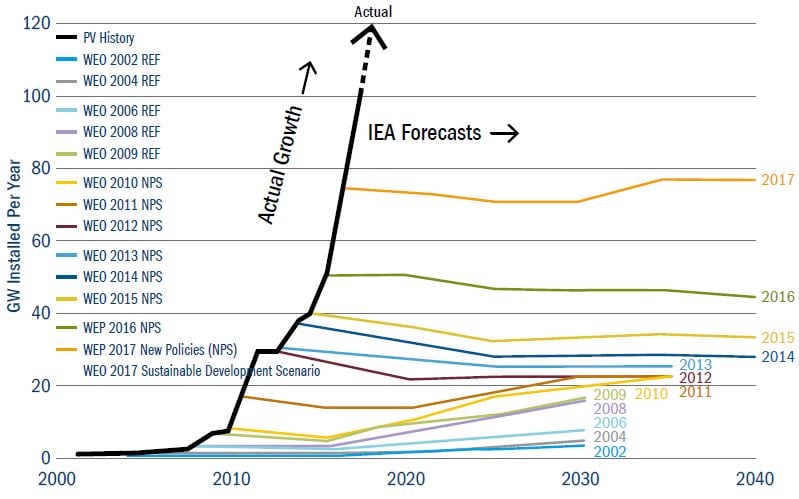
IEA new solar additions per year, forecast versus actual
Source: Visual Capitalist/IEA 2019

This demonstrates two characteristics (and biases) about human behaviour.
1. Changing our initial belief is emotionally challenging (Confirmatory Bias)
2. We struggle to forecast exponentially (Anchoring)

These biases can influence policy and investment decisions by overestimating the costs of the energy transition and underappreciating the potential for disruptive non-linear change. Models that often inform policy decisions are regularly based on assumptions that fail to capture the exponential nature of technology change. The IEA forecasts are a perfect example of this.

Other relationships such as feedback loops are poorly incorporated into most models. Doctor Matthew Ives from the University of Oxford gives the example of electric vehicles (EVs), whereby the uptake of EVs drives the demand of additional electricity which in turn furthers the experience curves of renewable generation, which in turn drives cost declines for renewable energy as well as reducing operational costs for EVs – further accelerating EV uptake4. Examples of this include Daimler, which forecast 2021 sales for new EVs to be 2x 2020, but the first half (H) year results of 2021 actually showed them at 4x; and Mercedes, which expected it would almost double its EV share in 2021 from 7% to around 13% – however EV sales more than quadrupled in H1 2021 alone to a share in excess of 10%5.

Cost parity between internal comebustion engine (ICE) vehicles and EVs is likely to occur around 2024-266, which could well prove to be a tipping point for further acceleration. Other tipping points could be related to overcoming range anxiety and concerns around secondary market resale value. Resale value concerns apply to both EVs and ICEs: for the former, while the technology is still new and a small share of the market, resale value is less certain at the point of purchase; and for the latter resale value uncertainty increases as governments introduce low emissions zones which make ICE operating costs higher relative to EVs. These non-cost-related drivers make forecasting even more difficult as they have the potential to accelerate exponential uptake.

Wright’s Law

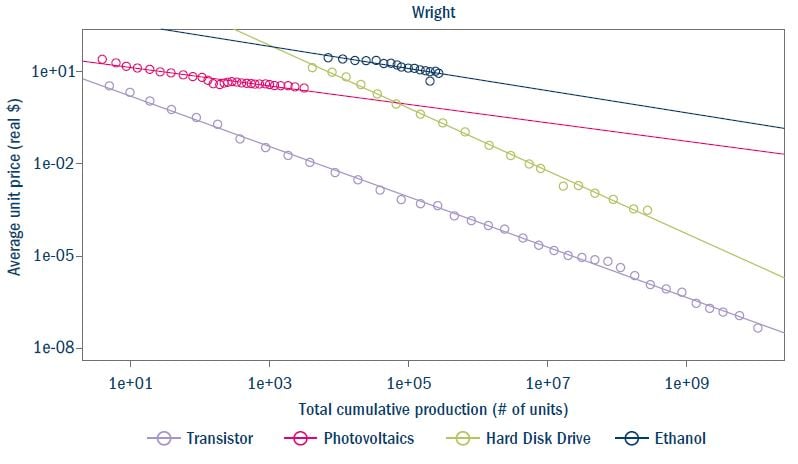
In contrast to large energy models, there are already empirical models that can more accurately predict the cost declines associated with new technologies. One example is Wright’s Law which shows that cumulative production creates a consistent decline in costs – i.e. the more we deploy the more we learn. Hence cost- decline graphs are often referred to as “learning curves”. A US aeronautical engineer named Paul Theodore Wright observed this relationship while making planes in world war two (WW2)7.

In 2016 academics J Doyne Farmer and Francois Lafond applied Wright’s Law and the similar Moore’s Law to multiple technologies and found that they enhanced forecast accuracy across many of them8. For solar photovoltaics, Wright’s Law has accurately predicted cost declines since 2016, even with recent polysilicon price increases (Figure 5).
Figure 5: Wright’s Law applied to different technologies
Wright’s Law applied to different technologies
Source: Farmer and Lafond, 2016. The graph shows how the average price decreases as the total number of units produced increases. Both axis use a log scale.
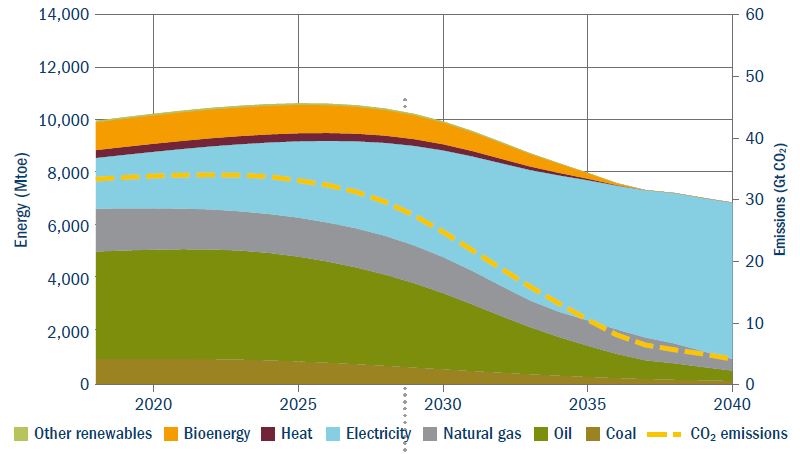
Using this research, Doctor Ives and his team found through using Wright’s Law that renewable energy has the potential to disrupt the current energy system. This exponential growth starts from a relatively small base today but from 2025 starts to have a significant and non-linear effect (Figure 6).
This scenario sees an 80% emissions reduction by 2040, without the need to deploy carbon capture and storage technologies (in contrast to the IEA scenarios). Furthermore, it is based purely on technology economics and does not factor in any benefits from climate change mitigation.
Figure 6: Global energy mix forecast using Wright’s Law to predict renewable energy cost declines
Global energy mix forecast using Wright’s Law to predict renewable energy cost declines
Source: Farmer and Lafond, 2016. The graph shows how the average price decreases as the total number of units produced increases. Both axis use a log scale.

Technology leap frogs

Partially as a result of such learning curves we have seen instance of “technology leapfrogging”, whereby developing markets can skip the adoption of a precursor technology. Two notable examples are telecoms and banking in emerging markets (EMs), where the widespread use of landlines has been bypassed and countries have leapfrogged straight from having no phones to using mobile phones; and in banking where certain countries have leapfrogged large traditional banking branch networks and moved straight to digital banking in the first instance.
It is likely this phenomenon will occur to some extent with the energy transition. As renewable technologies become increasingly competitive, they will likely serve some of the demand that would otherwise have been met with fossil sources. In emerging market regions new demand is being met by leapfrogging straight to renewables. Indeed, according to independent think tank Carbon Tracker, in 2019 87% of the growth in electricity supply came from non-fossil sources in emerging markets ex-China9.

Overcoming anchoring and conditions for exponential growth

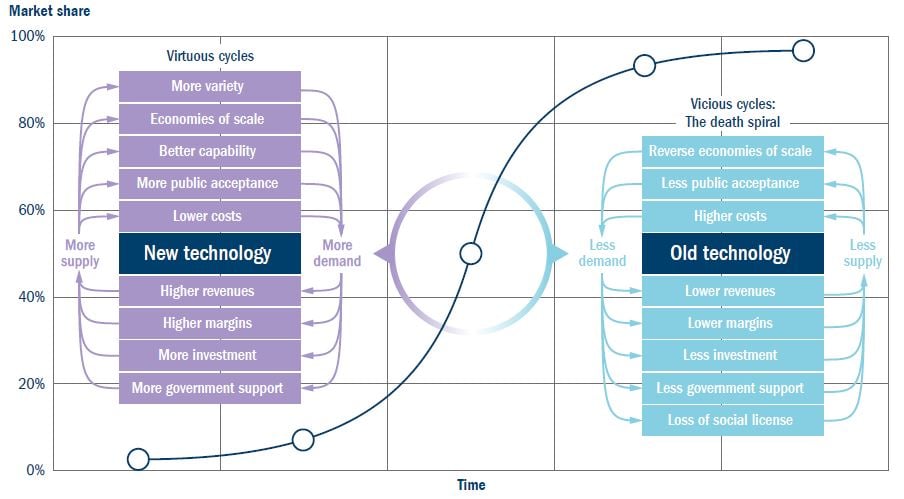
A critical question is why certain technologies grow exponentially and how these areas can be identified. Exponential growth is driven by the convergence of new technologies which trigger causal feedback loops within and across markets and sectors. Historically, these loops interact with and amplify one another, accelerating the adoption of new technology in a virtuous cycle while accelerating the abandonment of old technology in a vicious cycle. The relationship between EVs and renewable energy highlighted above has the potential to be one such example.

As a guide, Figure 7 serves as a high-level framework to consider new technology and whether it can achieve exponential status.
Figure 7: Virtuous and vicious cycles
Virtuous and vicious cycles
Source: Rethink Disruption 2022

In summary

The behavioural biases discussed in this article go some way to explaining why industry and analyst predictions of the cost and capacity required for decarbonising the global economy have been regularly beaten by real-life progress. When the Paris Agreement was signed in 2015, the IEA thought the cost of solar would still be higher than fossil electricity in 2040, and it anticipated a total installed capacity of 360GW of solar by 2020. Both of these predictions have been blown out of the water: by 2020 90% of new electricity generation was cheaper from renewables than from fossil fuels, and 710GW of solar had been deployed – almost double the 2015 estimate10.
Using the research of Dr Ives, Lafond, Farmer and others it is possible to start to look at more disruptive models and scenarios which, in our opinion, will be essential as the world moves along its bumpy road to net zero emissions.

“That’s the thing about exponential growth,
it doesn’t do much for a long time and then it comes and smacks you in the face.”
Dr Matthew Ives, 2022

Energy transition engagement: Green hydrogen

Company: Centrica

Sector and country: Energy, UK

Why we engaged

The company is in the process of updating its climate transition plan, with the aim to get to net zero by 2045, and for its customers to be net zero by 2050. This will include improving the number of smart meter customers, increases in the installation of EV charge points and heat pumps, and investing £100 million in low carbon and transition assets each year. We were interested in the role of green hydrogen in this process.


How we engaged

The company hosted an investor webinar.


What we learnt

The meeting enabled us to ask questions on the role of hydrogen in the domestic heating sector. Many experts are becoming sceptical around hydrogen’s role in this area. One reason being that heat pumps are about six times more efficient than green hydrogen. It was good to see that Centrica is balancing its efforts
between heat pumps and green hydrogen, and the company believes the hydrogen
value chain will evolve, with green hydrogen initially used in industry but expanding into domestic use. The UK is likely to be a test case for domestic hydrogen heating due to the development of hydrogen hubs and an abundance of very inefficient housing stock that could be better suited to hydrogen than heat pumps.


Outcome

We will continue to monitor developments at the company and within this field. Centrica’s leadership on energy transition and its role in the UK energy system provide a significant learning opportunity for us and the market more generally.

The exponential problems of predicting the future

4 oktober 2022
Belangrijkste onderwerpen
Gerelateerde onderwerpen
Listen on Stitcher badge
Belangrijkste onderwerpen
Gerelateerde onderwerpen

PDF

The exponential problems of predicting the future

Important information

For use by professional clients and/or equivalent investor types in your jurisdiction (not to be used with or passed on to retail clients). This is an advertising document. This document is intended for informational purposes only and should not be considered representative of any particular investment. This should not be considered an offer or solicitation to buy or sell any securities or other financial instruments, or to provide investment advice or services.
Investing involves risk including the risk of loss of principal. Your capital is at risk. Market risk may affect a single issuer, sector of the economy, industry or the market as a whole. The value of investments is not guaranteed, and therefore an investor may not get back the amount invested. International investing involves certain risks and volatility due to potential political, economic or currency fluctuations and different financial and accounting standards. Risks are enhanced for emerging market issuers.
The securities included herein are for illustrative purposes only, subject to change and should not be construed as a recommendation to buy or sell. Securities discussed may or may not prove profitable. The views expressed are as of the date given, may change as market or other conditions change and may differ from views expressed by other Columbia Threadneedle Investments (Columbia Threadneedle) associates or affiliates. Actual investments or investment decisions made by Columbia Threadneedle and its affiliates, whether for its own account or on behalf of clients, may not necessarily reflect the views expressed. This information is not intended to provide investment advice and does not take into consideration individual investor circumstances. Investment decisions should always be made based on an investor’s specific financial needs, objectives, goals, time horizon and risk tolerance. Asset classes described may not be appropriate for all investors. Past performance does not guarantee future results, and no forecast should be considered a guarantee either.
Information and opinions provided by third parties have been obtained from sources believed to be reliable, but accuracy and completeness cannot be guaranteed. This is an advertising document. This document and its contents have not been reviewed by any regulatory authority.
In Australia: Issued by Threadneedle Investments Singapore (Pte.) Limited [“TIS”], ARBN 600 027 414. TIS is exempt from the requirement to hold an Australian financial services licence under the Corporations Act and relies on Class Order 03/1102 in marketing and providing financial services to Australian wholesale clients as defined in Section 761G of the Corporations Act 2001. TIS is regulated in Singapore (Registration number: 201101559W) by the Monetary Authority of Singapore under the Securities and Futures Act (Chapter 289), which differ from Australian laws.
In Singapore: Issued by Threadneedle Investments Singapore (Pte.) Limited, 3 Killiney Road, #07-07, Winsland House 1, Singapore 239519, which is regulated in Singapore by the Monetary Authority of Singapore under the Securities and Futures Act (Chapter 289). Registration number: 201101559W. This advertisement has not been reviewed by the Monetary Authority of Singapore.
In Hong Kong: Issued by Threadneedle Portfolio Services Hong Kong Limited 天利投資管理香港有限公司. Unit 3004, Two Exchange Square, 8 Connaught Place, Hong Kong, which is licensed by the Securities and Futures Commission (“SFC”) to conduct Type 1 regulated activities (CE:AQA779). Registered in Hong Kong under the Companies Ordinance (Chapter 622), No. 1173058.
In Japan: Issued by Columbia Threadneedle Investments Japan Co., Ltd. Financial Instruments Business Operator, The Director-General of Kanto Local Finance Bureau (FIBO) No.3281, and a member of Japan Investment Advisers Association.
In the USA: Investment products offered through Columbia Management Investment Distributors, Inc., member FINRA. Advisory services provided by Columbia Management Investment Advisers, LLC. Collectively, these entities are known as Columbia Management.
In the UK: Issued by Threadneedle Asset Management Limited. Registered in England and Wales, Registered No. 573204, Cannon Place, 78 Cannon Street, London EC4N 6AG, United Kingdom. Authorised and regulated in the UK by the Financial Conduct Authority.
In the EEA: Issued by Threadneedle Management Luxembourg S.A. Registered with the Registre de Commerce et des Societes (Luxembourg), Registered No. B 110242, 44, rue de la Vallée, L-2661 Luxembourg, Grand Duchy of Luxembourg.
In Switzerland: Issued by Threadneedle Portfolio Services AG, Registered address: Claridenstrasse 41, 8002 Zurich, Switzerland.
In the Middle East: This document is distributed by Columbia Threadneedle Investments (ME) Limited, which is regulated by the Dubai Financial Services Authority (DFSA). For Distributors: This document is intended to provide distributors’ with information about Group products and services and is not for further distribution. For Institutional Clients: The information in this document is not intended as financial advice and is only intended for persons with appropriate investment knowledge and who meet the regulatory criteria to be classified as a Professional Client or Market Counterparties and no other Person should act upon it.
Columbia Threadneedle Investments is the global brand name of the Columbia and Threadneedle group of compa

Gerelateerde inzichten

12 november 2024

Vicki Bakhshi

Director, Responsible Investment

COP29: Will it deliver on climate finance?

With mitigation and adaptation needs running into hundreds of billions of dollars, and public finances stretched, the private sector will need to deliver much of the necessary ‘climate finance’
8 november 2024

CT SDG Engagement Global Equity Strategy

Download our Engagement Progress Report to discover deep analysis of our recent engagement and related outcomes.
17 oktober 2024

Natalia Luna

Senior Thematic Investment Analyst, Global Research

Power hungry AI - investment implications in the era of energy transition

Understanding the options for power provision and assessing the investment opportunities resulting from AI’s thirst for energy.
Read time - 2 min
12 november 2024

In Credit Weekly Snapshot – November 2024

Our fixed income team provide their weekly snapshot of market events.
12 november 2024

Vicki Bakhshi

Director, Responsible Investment

COP29: Will it deliver on climate finance?

With mitigation and adaptation needs running into hundreds of billions of dollars, and public finances stretched, the private sector will need to deliver much of the necessary ‘climate finance’
11 november 2024

Paul Doyle

Head of Europe ex-UK Equities

European reform must wait as the US continues to advance

The continent is struggling with competitiveness and needs to cut interest rates faster – but even that may not be enough.
true
true

Important information

For use by professional clients and/or equivalent investor types in your jurisdiction (not to be used with or passed on to retail clients). This is an advertising document. This document is intended for informational purposes only and should not be considered representative of any particular investment. This should not be considered an offer or solicitation to buy or sell any securities or other financial instruments, or to provide investment advice or services.
Investing involves risk including the risk of loss of principal. Your capital is at risk. Market risk may affect a single issuer, sector of the economy, industry or the market as a whole. The value of investments is not guaranteed, and therefore an investor may not get back the amount invested. International investing involves certain risks and volatility due to potential political, economic or currency fluctuations and different financial and accounting standards. Risks are enhanced for emerging market issuers.
The securities included herein are for illustrative purposes only, subject to change and should not be construed as a recommendation to buy or sell. Securities discussed may or may not prove profitable. The views expressed are as of the date given, may change as market or other conditions change and may differ from views expressed by other Columbia Threadneedle Investments (Columbia Threadneedle) associates or affiliates. Actual investments or investment decisions made by Columbia Threadneedle and its affiliates, whether for its own account or on behalf of clients, may not necessarily reflect the views expressed. This information is not intended to provide investment advice and does not take into consideration individual investor circumstances. Investment decisions should always be made based on an investor’s specific financial needs, objectives, goals, time horizon and risk tolerance. Asset classes described may not be appropriate for all investors. Past performance does not guarantee future results, and no forecast should be considered a guarantee either.
Information and opinions provided by third parties have been obtained from sources believed to be reliable, but accuracy and completeness cannot be guaranteed. This is an advertising document. This document and its contents have not been reviewed by any regulatory authority.
In Australia: Issued by Threadneedle Investments Singapore (Pte.) Limited [“TIS”], ARBN 600 027 414. TIS is exempt from the requirement to hold an Australian financial services licence under the Corporations Act and relies on Class Order 03/1102 in marketing and providing financial services to Australian wholesale clients as defined in Section 761G of the Corporations Act 2001. TIS is regulated in Singapore (Registration number: 201101559W) by the Monetary Authority of Singapore under the Securities and Futures Act (Chapter 289), which differ from Australian laws.
In Singapore: Issued by Threadneedle Investments Singapore (Pte.) Limited, 3 Killiney Road, #07-07, Winsland House 1, Singapore 239519, which is regulated in Singapore by the Monetary Authority of Singapore under the Securities and Futures Act (Chapter 289). Registration number: 201101559W. This advertisement has not been reviewed by the Monetary Authority of Singapore.
In Hong Kong: Issued by Threadneedle Portfolio Services Hong Kong Limited 天利投資管理香港有限公司. Unit 3004, Two Exchange Square, 8 Connaught Place, Hong Kong, which is licensed by the Securities and Futures Commission (“SFC”) to conduct Type 1 regulated activities (CE:AQA779). Registered in Hong Kong under the Companies Ordinance (Chapter 622), No. 1173058.
In Japan: Issued by Columbia Threadneedle Investments Japan Co., Ltd. Financial Instruments Business Operator, The Director-General of Kanto Local Finance Bureau (FIBO) No.3281, and a member of Japan Investment Advisers Association.
In the USA: Investment products offered through Columbia Management Investment Distributors, Inc., member FINRA. Advisory services provided by Columbia Management Investment Advisers, LLC. Collectively, these entities are known as Columbia Management.
In the UK: Issued by Threadneedle Asset Management Limited. Registered in England and Wales, Registered No. 573204, Cannon Place, 78 Cannon Street, London EC4N 6AG, United Kingdom. Authorised and regulated in the UK by the Financial Conduct Authority.
In the EEA: Issued by Threadneedle Management Luxembourg S.A. Registered with the Registre de Commerce et des Societes (Luxembourg), Registered No. B 110242, 44, rue de la Vallée, L-2661 Luxembourg, Grand Duchy of Luxembourg.
In Switzerland: Issued by Threadneedle Portfolio Services AG, Registered address: Claridenstrasse 41, 8002 Zurich, Switzerland.
In the Middle East: This document is distributed by Columbia Threadneedle Investments (ME) Limited, which is regulated by the Dubai Financial Services Authority (DFSA). For Distributors: This document is intended to provide distributors’ with information about Group products and services and is not for further distribution. For Institutional Clients: The information in this document is not intended as financial advice and is only intended for persons with appropriate investment knowledge and who meet the regulatory criteria to be classified as a Professional Client or Market Counterparties and no other Person should act upon it.
Columbia Threadneedle Investments is the global brand name of the Columbia and Threadneedle group of compa

Misschien vindt u dit ook interessant

Over ons

Miljoenen mensen over de hele wereld laten het beheer van hun geld aan Columbia Threadneedle Investments over. We beheren de beleggingen van particuliere beleggers, financieel adviseurs, vermogensbeheerders, verzekeringsmaatschappijen, pensioenfondsen en andere instellingen.

Fondskoersen en vergoedingen

Columbia Threadneedle Investments heeft een uitgebreid aanbod aan beleggingsfondsen, passend bij uiteenlopende doelstellingen.

Beleggingsbenadering

Uw succes staat bij Columbia Threadneedle hoog in het vaandel. De spil van onze ambitie om consequent successen te boeken voor onze cliënten is onze opvallend unieke beleggingsbenadering, waarbij vier beloften centraal staan.

Bevestig nog een paar gegevens over uzelf om toegang te krijgen tot uw voorkeurencentrum

*Verplichte velden

Er is iets mis gegaan, probeer het alstublieft nogmaals

Dank je. U kunt nu naar uw voorkeurencentrum gaan om te kiezen welke inzichten u per e-mail wilt ontvangen.

Ga naar uw voorkeurencentrum om te bekijken en bij te werken welke inzichten u van ons per e-mail ontvangt.